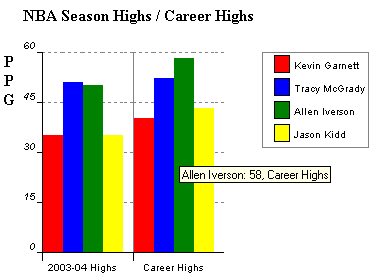
After you have successfully installed
the ASP Report Wizard, copy the following code into your ASP file, to generate
a simple graph similar to the one below:

<%
'declare variables
Dim objGraph
' Create an instance of SimpleGraph
Set objGraph = Server.CreateObject("AspWebSolution.SimpleGraph")
With objGraph
'Add some data
Call .AddRowData("Kevin Garnett","35,40")
Call .AddRowData("Tracy McGrady","51,52")
Call .AddRowData("Allen Iverson","50,58")
Call .AddRowData("Jason Kidd","35,43")
'Add some variables
.XScaleValues = "2003-04 Highs,Career Highs"
.xALign = "center"
.yLabel = "PPG"
.Title = "NBA Season Highs / Career Highs"
'Space the groups
.Spacing = 10
'You can chage the colors if you want
'.Colors = "green, red, yellow, blue, orange, fuchsia"
End With
'Draw your graph
objGraph.Draw
Set objGraph = Nothing
%>
Top
See Also

